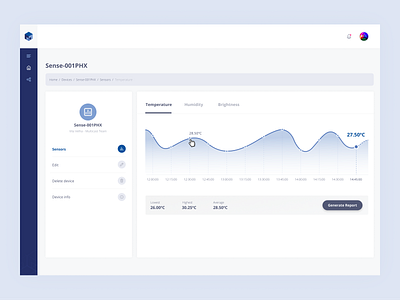
Charts dashboard for devices info analysis
[Multicast Sense Up Project] A detailed screen of charts dashboard to analyse devices info like temperature, humidity, brightness and pressure of a place.
With this system people are able to check the situation of labs products online through the desktop or app version :)
Read more: https://jeffersonbessa.com/web-app-design-system-multicast
More by Jefferson Bessa View profile
Like

