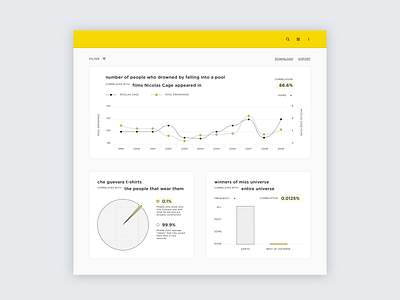
Daily UI #018 Analytics Chart Presentation
For today's daily ui challenge I decided to take a rather dry topic, data design, and make myself laugh while working on it.
Credits for data sets go out to Spurious Correlations and Bored Panada.
More by Kate O'Reilly View profile
Like
