In the Zone
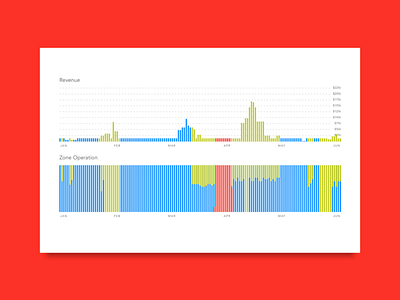
Another data visualization for a simulation application I designed for a client in the energy sector. This set of graphs shows various levels of productivity and how they effect revenue.
More by Purple, Rock, Scissors View profile
Like
