Constituent visualization
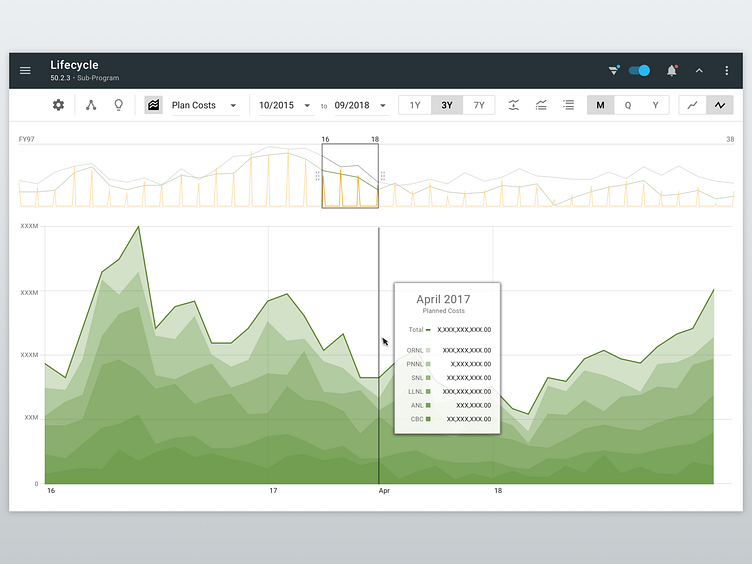
In this modified state of the Lifecycle view, the user has turned on “constituents-in-chart” mode. This allows the user to see how one particular data type (planned costs in this case) breaks down by its constituent performers over a period of time.
For more context about this view, check out this Dribbble bucket.