Salaries and years of experience
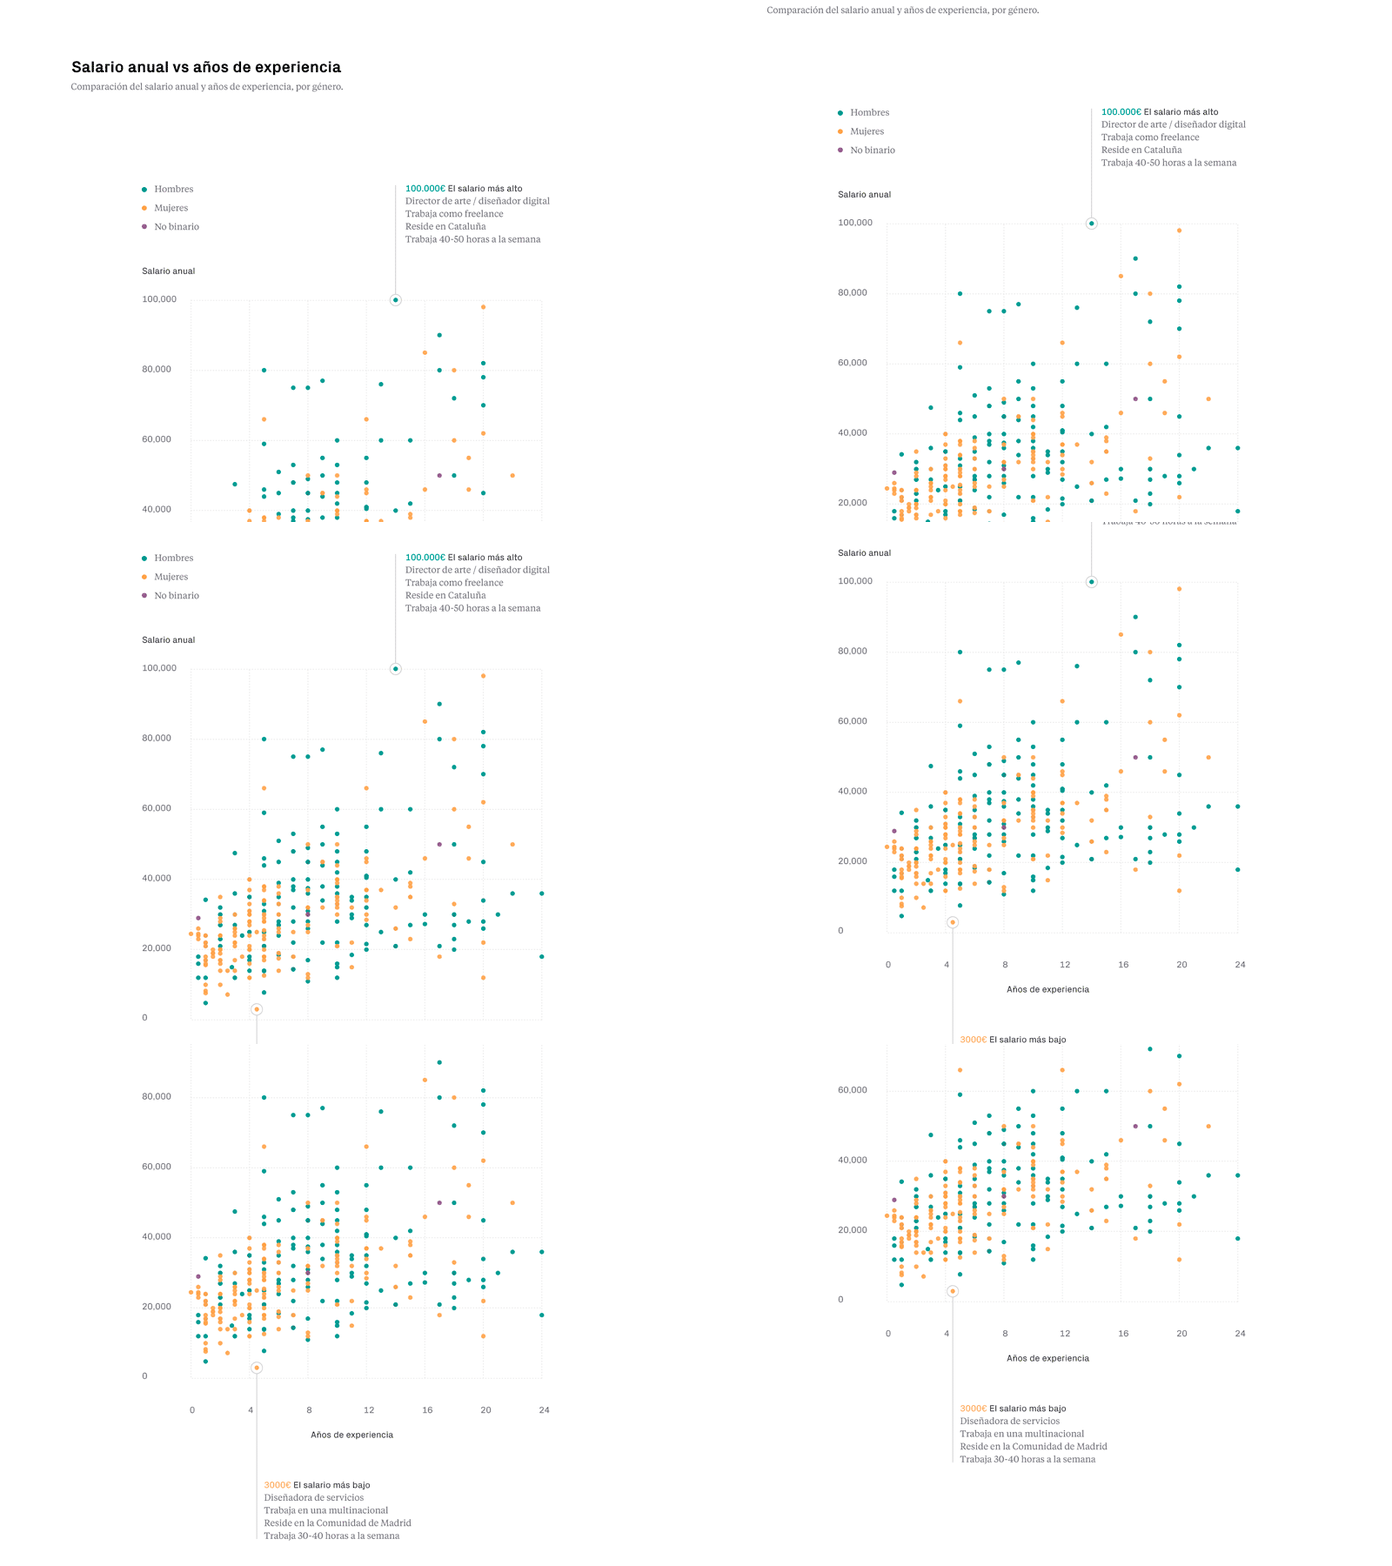
This visualization shows a comparison between the annual salary and years of experience. The green color is men, yellow women and purple non-binary.
The participant with the highest salary is a man, working 40-50 hours a week in digital design as a freelance. The lowest salary is a woman, working 30-40 hours a week working as a service designer at a multinational company.
This is number 6 of 8 data visualizations about the salaries of designers in Spain.
I turned the data collected from an anonymous Excel sheet into visuals, using various data visualization techniques and tools.
These days I’m sharing the data visualizations with the results of the questionaire. (Pst, I already shared it on Instagram)
More by Gemma Busquets View profile
Like
