News in Graphics – Infographic
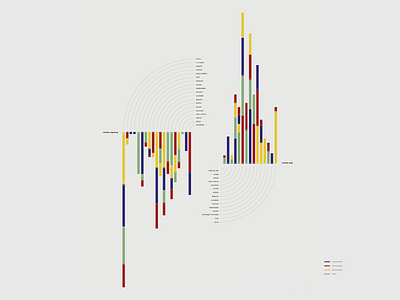
Percentage occupied by each section
The data entered in this infographic was obtained by counting articles that each section contains, both in its printed version and in the web version. From the totality of articles of each version, it was possible to reach the percentage that each section occupies. As we can see, not all sections are common to the four newspapers. In addition, the sections in the printed version differ from those in the web version.
Full project:
www.behance.net/gallery/48516177/News-in-Graphics