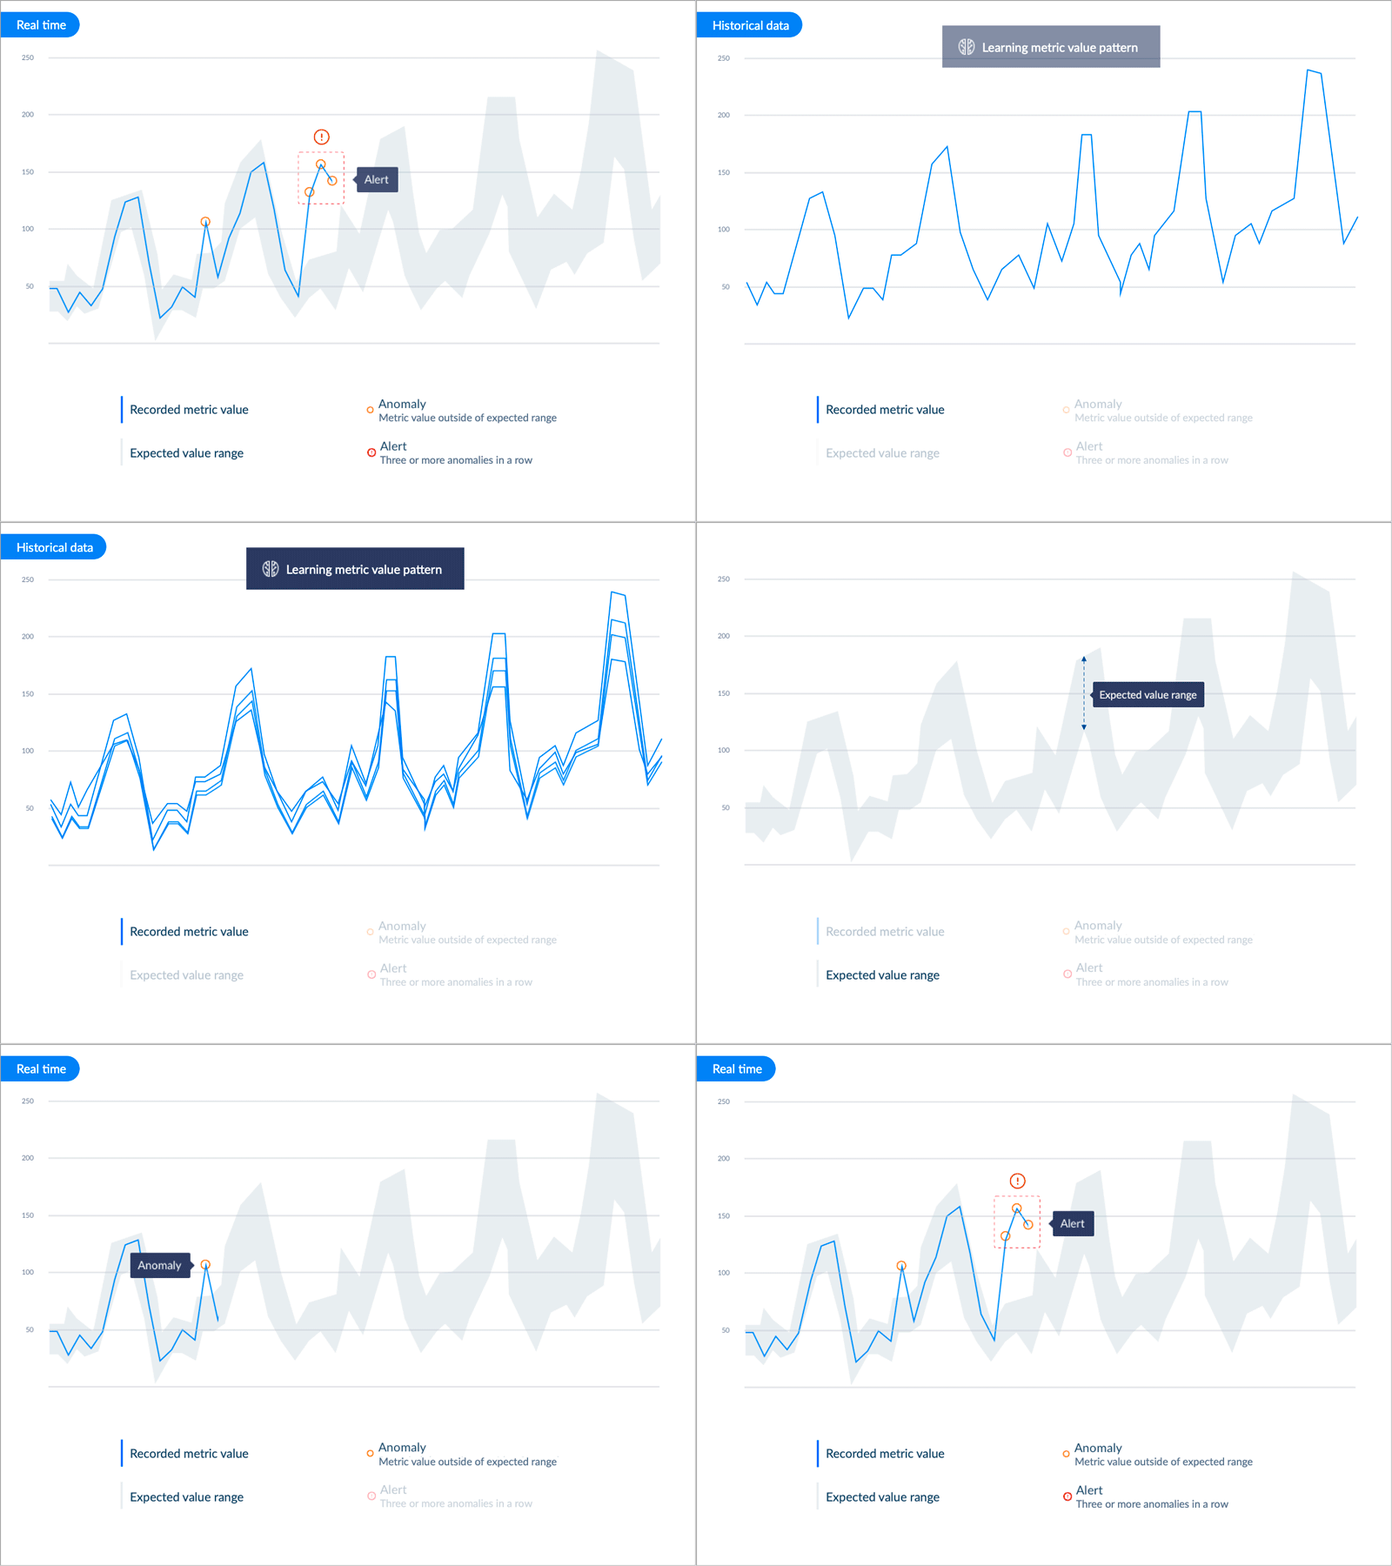
Animation of metric anomaly alerts powered by machine learning
Note: The animation is meant to start at the "Historical data" phase.
This animation aims to explain roughly how Machine Learning learns the normal pattern of the tracked metrics, identify anomalies and raise alerts when three or more anomalies in a row are detected.
It can be found on the documentation website of the company.
Like
