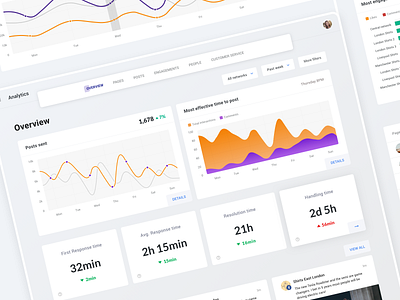
Analytics dashboard - graphs
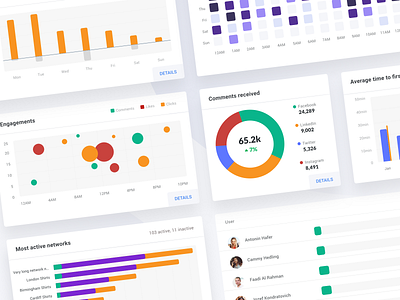

Another shot of previously shared analytics for a social media enterprise platform. There's more than 40+ different charts so I used brighter colours for each stat to stand out while scrolling past it. Also, social media is supposed to be fun, even at the enterprise level!