Financial App
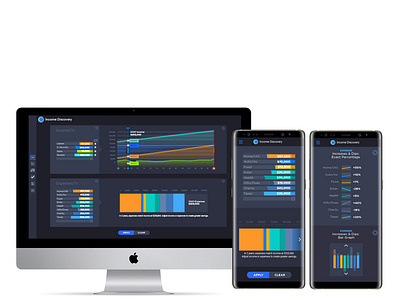
Typically, data is entered from a separate and more archaic “Excel” type interface. My new concept enables users to manipulate data directly on charts, with real-time feedback. As data is altered in any chart or settings area, data visualization reflects those updates in real time. Users can add and delete income sources, time-points (blue) to assess exact figures from various income sources, and drag the time-line (red) to alter the duration. Other features include a profile manager, new chart creation, chart comparison, help and settings. The lower navigation icons control alternate chart designs, save current chart, PDF creator and email charts. More user-friendly GUIs opens the doors to greater users of digital products, making data providers more profitable.
