OWASP / WAF dark dashboard (futuristic exploration)
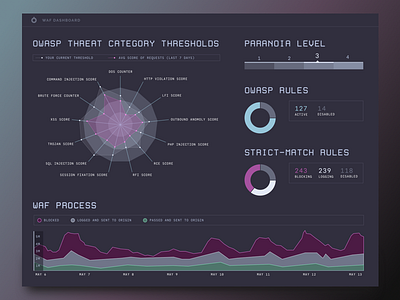
At a glance dashboard showing the OWASP threat category thresholds on a radar chart (to compare the thresholds to the average scores), paranoia level bar (levels 1-4), and pie chart summaries of OWASP and strict-matching rules. Stacked line graph shoes the WAF processing requests live or over a time span.