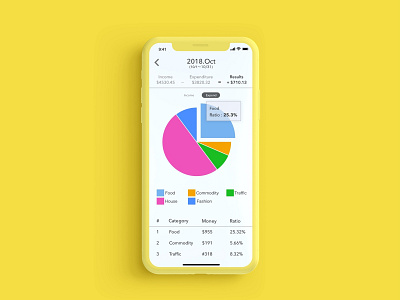
DailyUI 018 :: Analytics Chart
#dailyuichallenge
#dailyui #ui #ux #uiux #webdesign
#dailyui018
#analyticschart
I made a graphic chart page of "Income & expenditure" which is supposed to use in a (household) account book app. You can tell what category is most spent and how much you was able to save money. I hope you like it and leave some comments!
More by Shinsuke Uematsu View profile
Like
