Distribution Infographic - 24 Hour Orders (part 3 of 4)
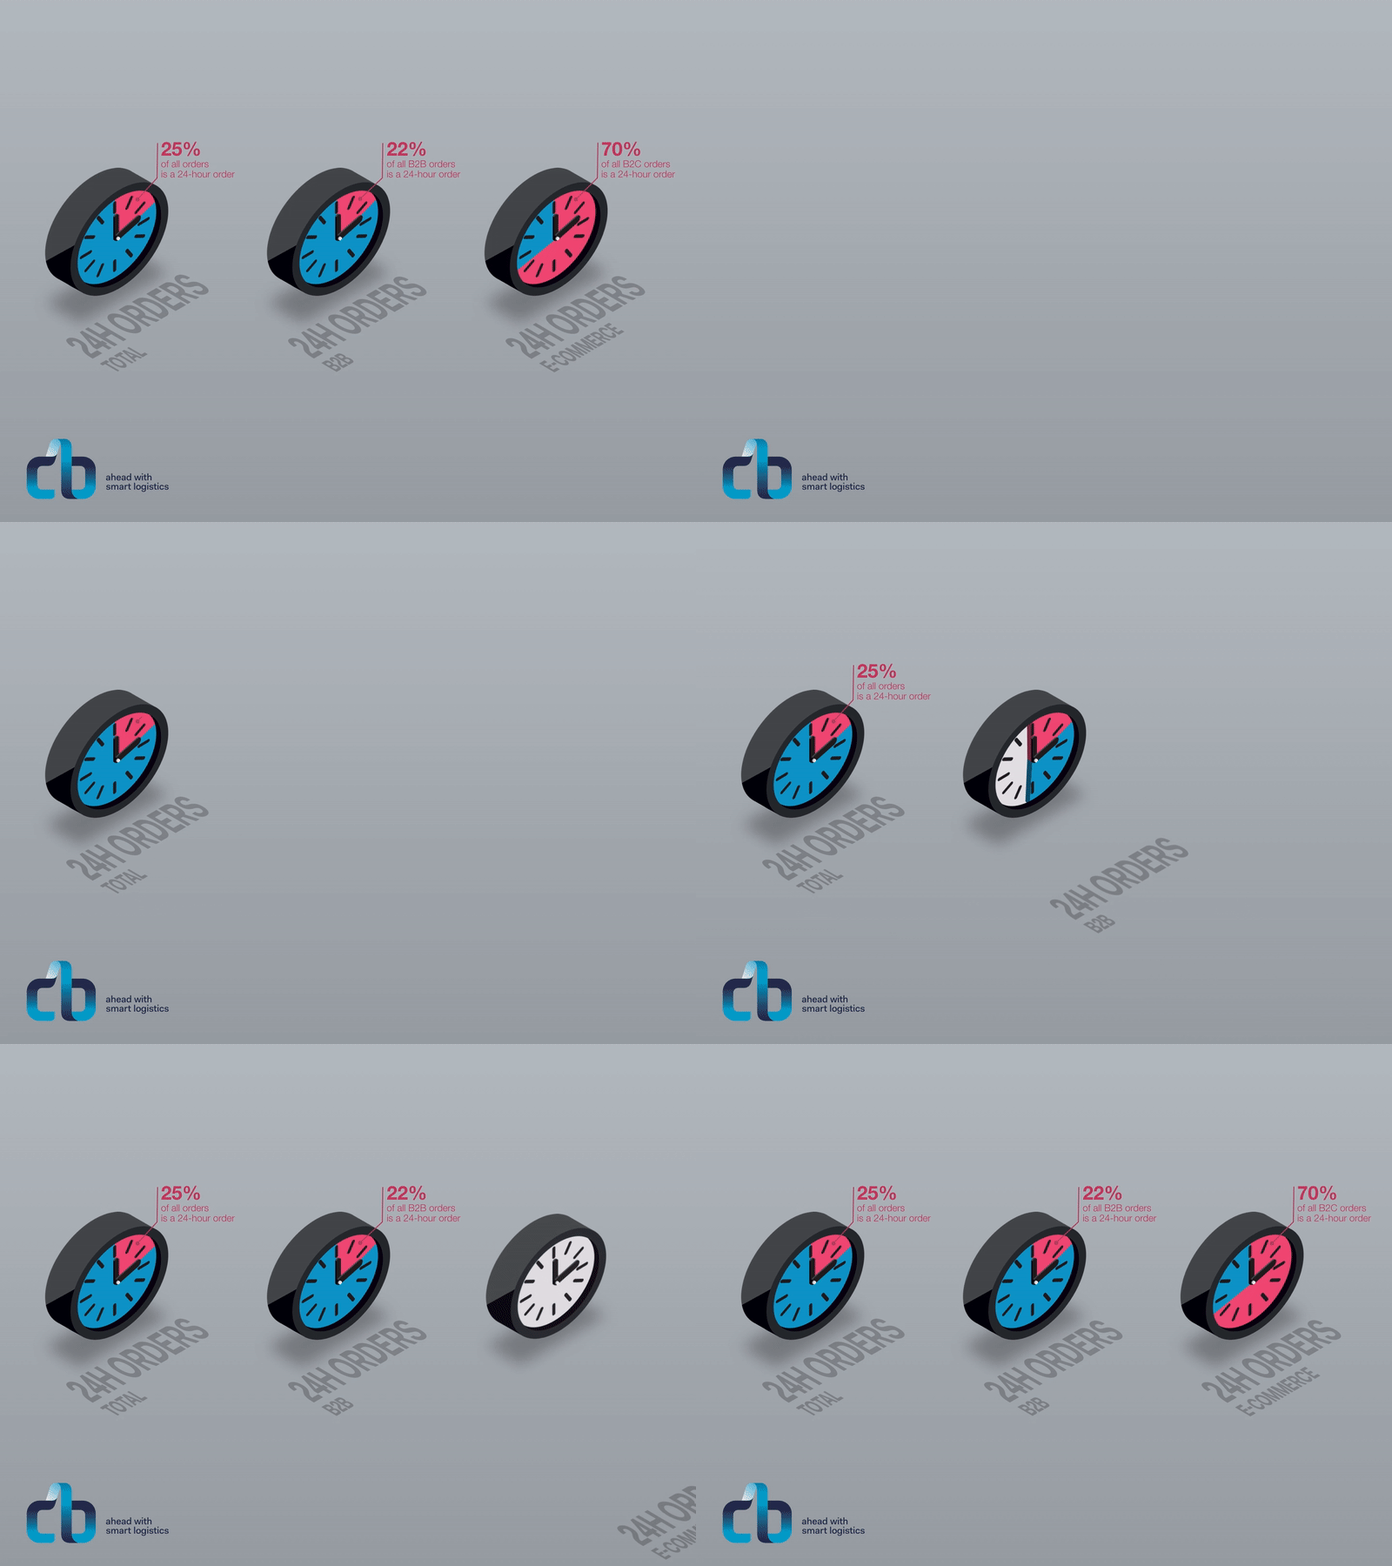
Part of a big distribution infographic. Storytelling by means of animated visuals representing actual distribution data. Anonymized for this publication.
This one shows the share of 24 hour orders in relation to longer lead times, split in total, B2B and e-commerce sales.
This is part 3 of 4. See also the other animations!
More by Timo Boezeman View profile
Like
