Zoocasa Report Systems
Happy Tuesday! ☕✨
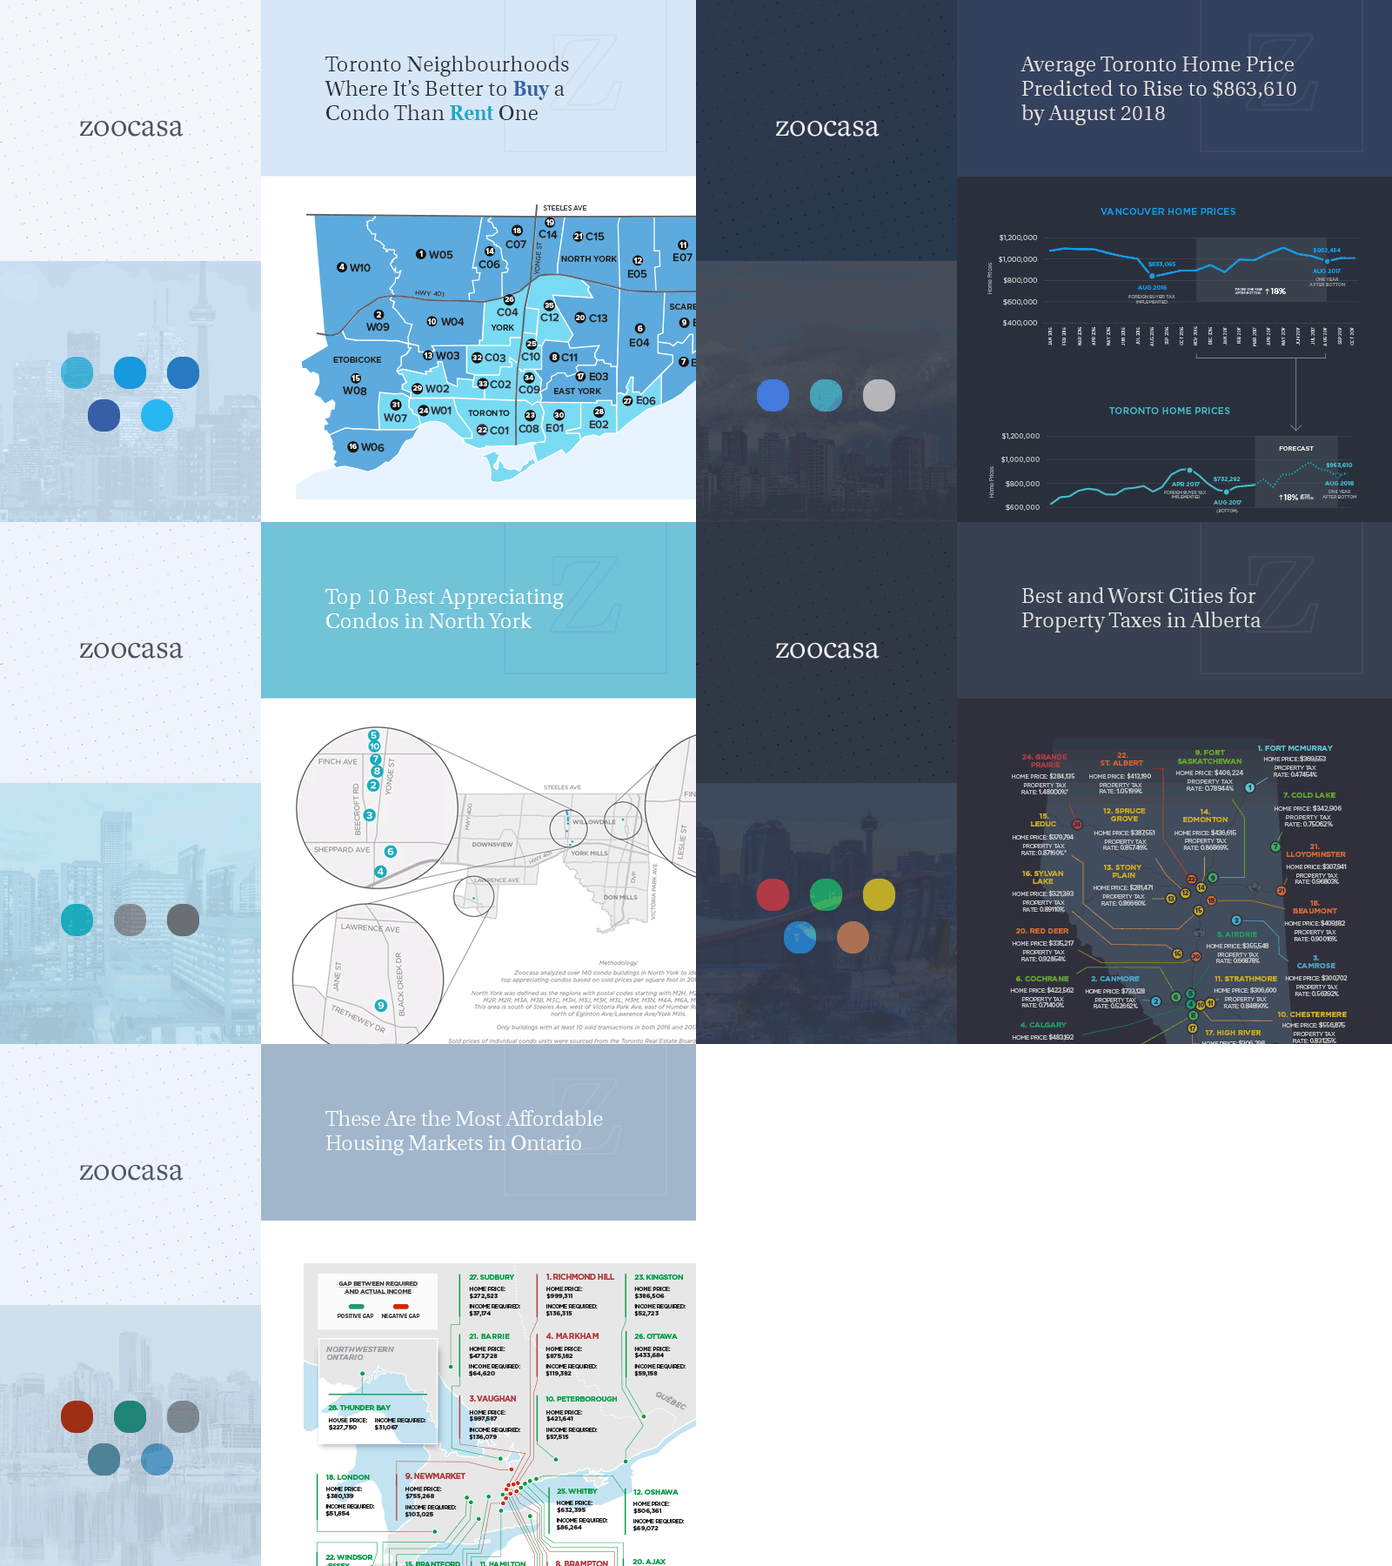
I always thought it'd be neat if our infographics each had their own visual system depending on if you were presenting stats about property taxes or affordability.
So, I've assigned each report type a specific colour palette and map style. Which do you prefer?
Hit "L" if you dig any of these! ❤️
See more of our infographics here: https://www.zoocasa.com/blog/category/infographics
More by Kristyna Gottvald View profile
Like

