Figma data design. Bullet charts
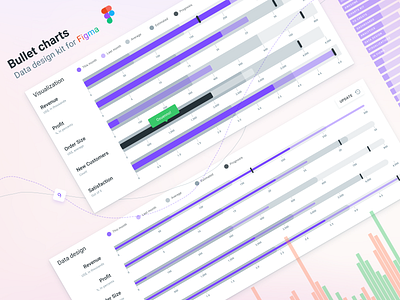


A bullet graph is a variation of a bar graph developed by Stephen Few. Seemingly inspired by the traditional thermometer charts and progress bars found in many dashboards, the bullet graph serves as a replacement for dashboard gauges and meters. Start your material design charts prototyping right now.
🍩 Try before you buy!
📂 Full project on Behance
📖 My data visualization encyclopedia