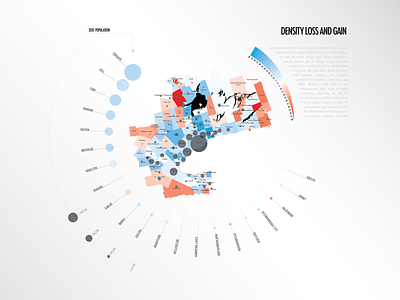
The Greater Toronto Area Density Change
This map was created by analyzing data in Excel, then using Adobe Illustrator to visualize how the density of certain municipalities will change over time based on the amount of allocated land for development.
More by Jeff Davidson View profile
Like
