Database stats (graph view)
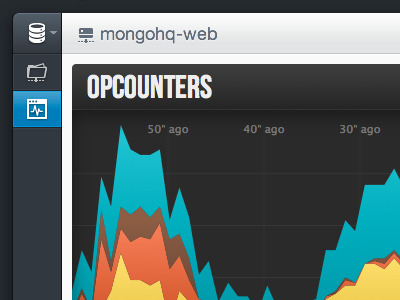
The graph view is rendered in SVG using D3.js and Backbone.js. Data is pushed in real time via Pusher. I'm designing this whole app with a mobile-first approach. In this shot the side navigation is collapsed because the browser window is between 320px and 550px wide.