Tracker Graph Area
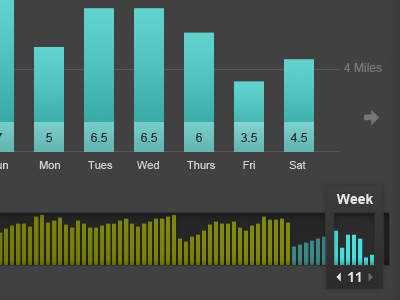
Top chart shows data for a one week period of time, lower slider shows data over the entire period of time, allows user to slide over to previous / next weeks data. Campaign data and regular data shown with different colors to differentiate the data.