Data visualization: Cardiovascular disease
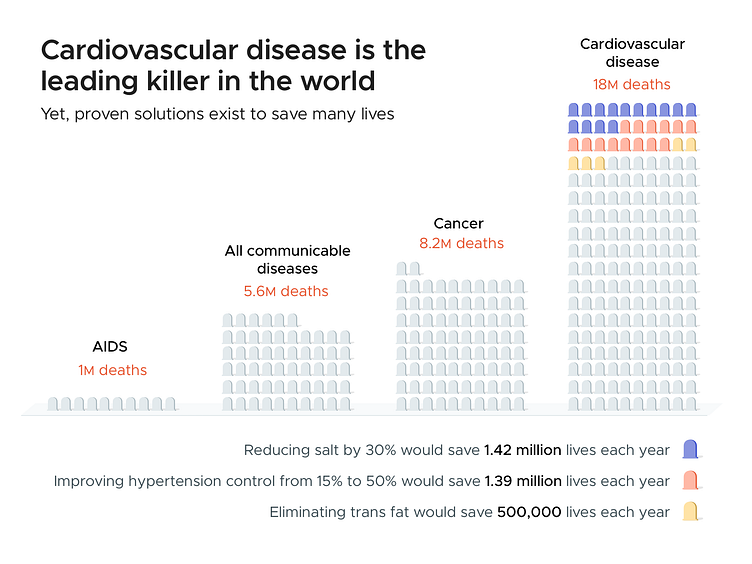
I'm taking a stab at some data visualizations this week. This one shows the relative scale of the challenge, but also the optimistic opportunity to save many lives.
The audience is health administrators for large regions and countries. The goal is to prioritize the three interventions.
Feedback and critique is welcome.
More by Daniel Burka View profile
Like
