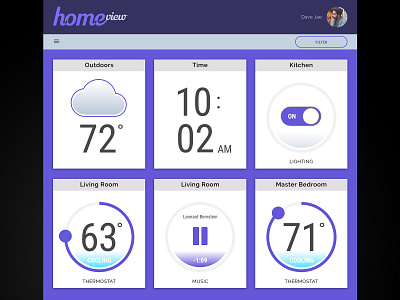
Home Monitoring
Day 21 of the 100 day UI challenge! Home Monitoring. Charts and lines and graphs make data look great, but for a home user we should stick to the basics. Easy to read quick glance information and controls. Something logical and clean. This was a fun project!
More by Michael Cullinan View profile
Like
