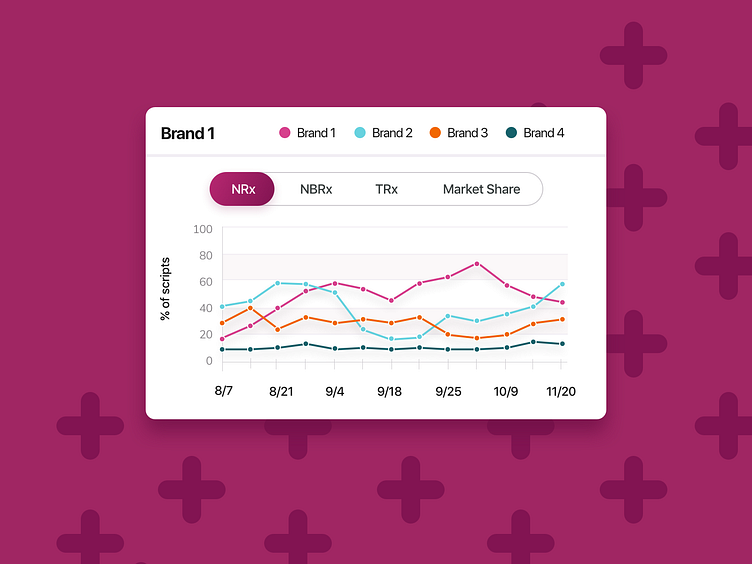
Line Graph Exploration
I worked on creating some graphing styles for a large pharmaceutical data project earlier this year. I was tasked to create a dashboard that reflected sales of different brands over the course of 13 weeks. This is a card-view of how a certain drug brand is performing. The user is able to toggle between different kinds of prescriptions to view their performance. Tapping on the whole graph itself takes the user to a full-screen, deeper-dive view of the brand's performance.
More by Lindsay Schofield View profile
Like
