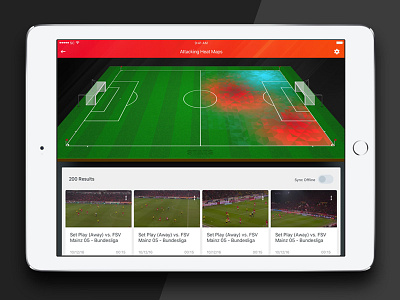
Stats - iPad Attacking Heat Maps
The practical application of the pitch visualization I previously posted is to allow a coach to digest a large portion of video data at once. The pitch provides a meaningful visualization on how a team attacks and also allows him to draw on this pitch to only return videos that are in areas of interest.
The initial posts of this project will be a broader view of the UX and I will circle back to showcase specific interactions (like the one explained above).
More by Ryan Nasipak View profile
Like

