#018 Analytics Chart
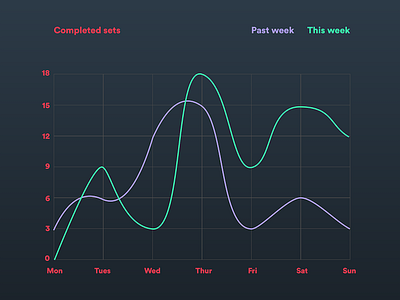
This chart is for a fitness program. The user has six different exercises with three sets each. The line graph is here to have an idea on the progress and it is easy to see if the user was more committed this week or the week before.
Check my portfolio to see the animation I designed with After Effects!