Daily UI Challenge #018 - Analytics Chart
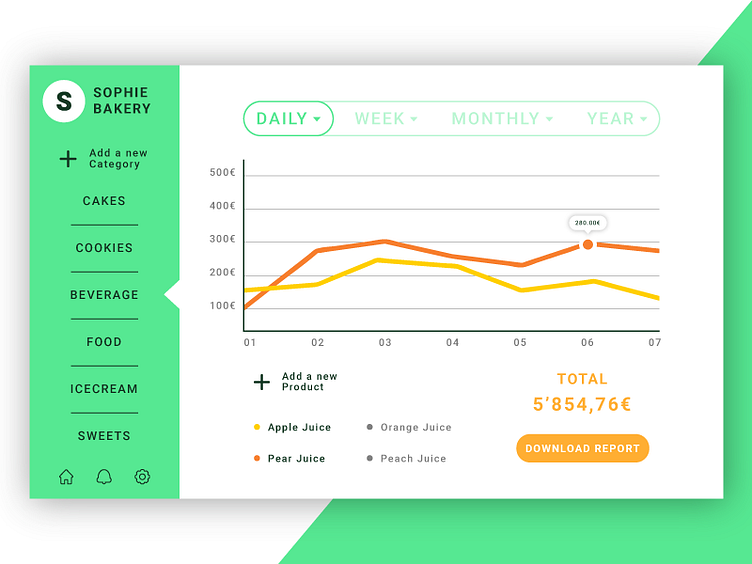
I think this challenge is very important to make practice: Graphic Design is not just about decoration, but first of all it's about explaining contents; and an Analytics Chart has to communicate much information. The task is to communicate data in a simple way and to make data management easier.
I spent about a week on this because I wanted that the user Interface could be easier and more intuitive.
Text and Copywriting, both in projects and in descriptions, is written by Ivan Cunzolo.
🎨 Press "L" if you like it or leave a comment, thanks! 😄