Career Streamgraph
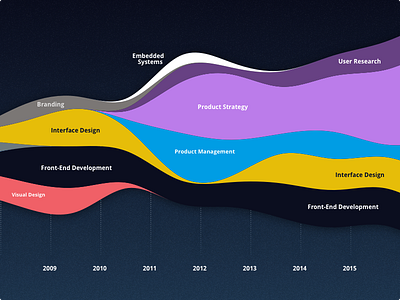

I wanted to show what skills I was using most over different times in my career, so I opted for a streamgraph visualization. I used Airtable as a database with up to 5 skills per year and the concentration of my time I was using towards each skill. Over time, you see different focuses converge and stretch as I transition to different roles.