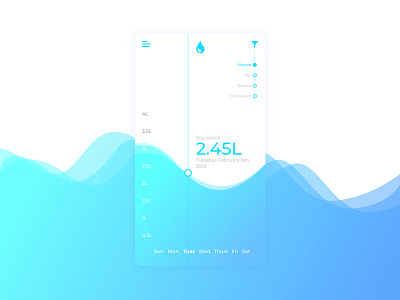
DailyUI 018 - Analytics Chart
Eighteenth day of the 100 day DailyUI Challenge.
The prompt was analytics chart. Wanted to do something people track (or should track) on a daily basis that I could also have a little fun with visually. Brining in that water metaphor ALL over the place!
More by Dylan Bobier View profile
Like
