Multiple Series 3D Bar Chart

Multiple series 3D bar chart is a 3-dimensional chart and is used for data sets with 3 data points. Consider an XYZ axis graph. Two axes (let’s say X & Y) have data points that can be measured in the same unit, and this unit is represented on the third axis (Z axis).
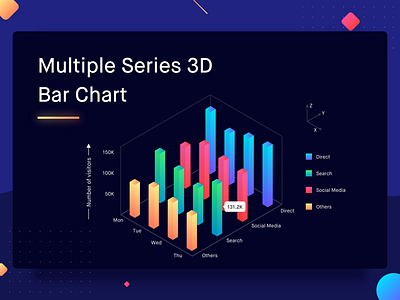
Let us plot the same example we’ve been looking at using multiple series 3D bar charts. Our 3 data points are — the number of visitors to the website, the days of the week and the source of the visits. If we plot the days of the week on the X-axis and the sources on the Y-axis, the bar plotted along the Z-axis would give us the number of visitors on a website for a particular day and a particular source. The length of the bar gives you the value of the variable being measured. The position of the bar chart on the plane gives us the category being compared.
Best Practices for Multiple Series 3D Bar Chart
1. When plotting the Multiple Series 3D Bar Chart, it is very important that the margins between the bars on the X and Y axis are different. Otherwise, the bars behind might not be clearly visible because of the bars in front.
2. Use multiple series 3D bar chart for limited data sets only, as large datasets will be very difficult to read with this chart.