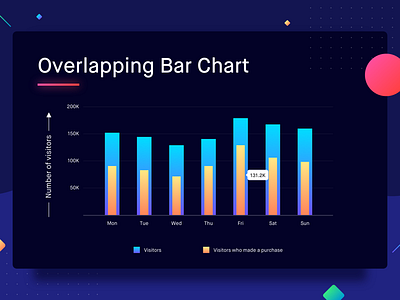
Overlapping Bar Charts
An overlapping bar chart is one of the less popular bar charts but can be really useful in certain cases. Similar to grouped bar charts, overlapping bar charts are used to represent a comparison between two categories on the basis of multiple variables. But that’s not all, it’s specifically used when one variable is a part of another variable.
Given below is an overlapping bar chart that shows the number of visitors on an e-Commerce website along with the number of purchases. The blue bar denotes the number of visitors to the website and the yellow denotes how many of those visitors made a purchase. The number of visitors who made a purchase on the website is a subset of the number of visitors.
Best Practices for Overlapping Bar Charts
1. Even though overlapping bar charts can be used to show multiple levels of subsets, the number of levels shouldn’t be more than 3 as it will become difficult to represent.

