How much will your travel vaccines cost you? | Data Visualiation
Client: Travel Supermarket
Project: How much will your travel vaccines cost you?
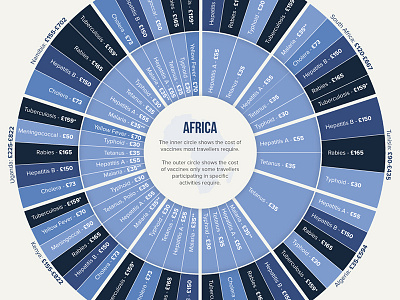
Brief: To create a series of information designs, visualising the cost of different vaccines spanning across 6 continents. The design needed to also include vaccines which are required for most travellers as well as just some travellers, depending on what activities they will be participating in during their travels.
After sketching many variations of the types of graphs that could work with this data set, I decided to use a multi-level pie chart. This was found to be the best format to clearly display a lot of information in one graph; colour coding the segments in order of cost and creating an inner and outer ring which depicted "most travellers" and "some travellers".
To view the full series of 6 designs: https://www.behance.net/gallery/59878461/Vaccinations-Data-Visualisation


