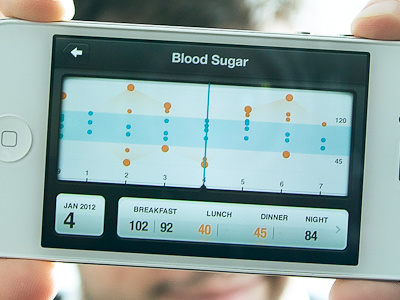
Blood Sugar Chart
Working on a way to visualize blood sugar readings for diabetics in a way that makes sense. I grouped the data by days and didn't spread them out like most examples I've seen as the selected day will populate the lower section by before & after each meal. I also highlighted the lows & highs in an effort to influence users to stay within their range. You can also click to see the standard spreadsheet of exact times. From there you can send to your doctor or whomever. Hopefully this will be live within the next few months.
That was a mouth-full.
More by Anthony Lagoon View profile
Like


