HBR dataviz#2
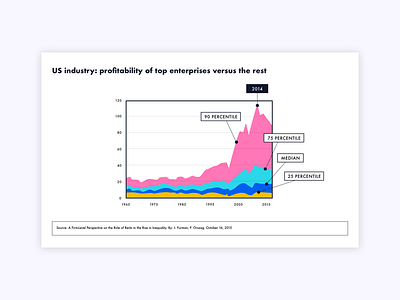
"Stacked Area Chart is similar to the simple Area Chart, but here is uses multiple data series that start each point from the point left by the previous series. It is useful for comparing multiple variables changing over interval."
📎 cit from this really nice project
http://datavizproject.com/
by Ferdio
👏👏👏
Check it out :)