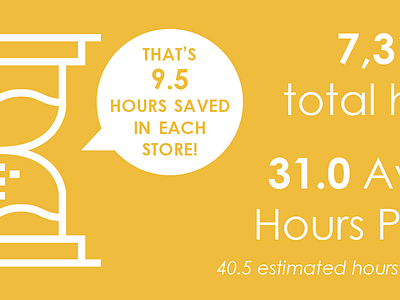
End of Cycle Infographic
Infographic that I originally mocked up in Adobe Illustrator, which was later curated into an interactive dashboard in Tableau.
ht_eoc_infographic.pdf
1 MB
More by Nicolette Shasky View profile
Like
