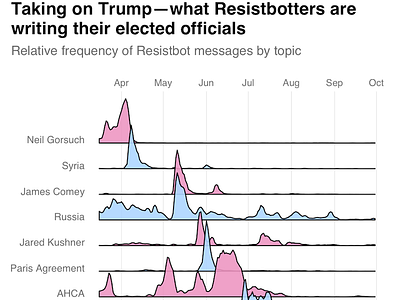
I analyzed Resistbot data, measured the popularity of various topics that Americans were writing about to their elected officials, and visualized the result as a joyplot/ridgeline plot. You can see the whole thing here.