Dashboard Design
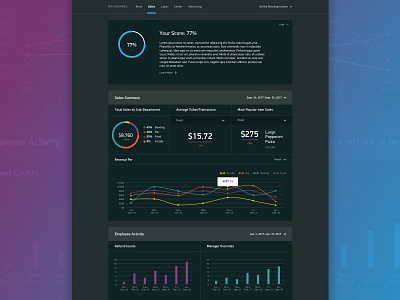
Pie charts and line graphs and bar graphs, oh my! I’m excited to see how this design system has played out throughout the rest of the graph types used in this dashboard system. These graphs will allow bowling alley management teams to easily parse information about their bowling alley in terms of sales, labor, center, and marketing performance.
These bright colors are giving me some serious flashbacks to grade school bowling parties back in the ‘90s, but hey they’re looking pretty fresh here, right? And, as they say, what goes around comes around!
More by Kaitlyn Malson View profile
Like
