Data Visualization
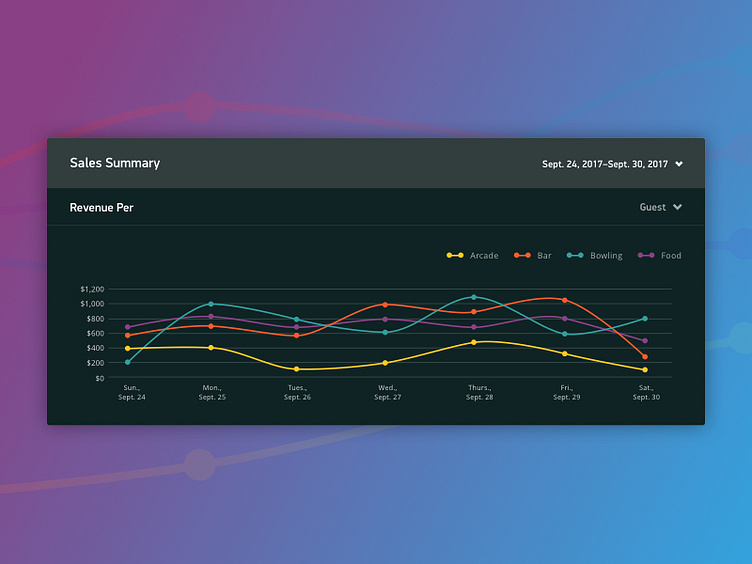
Graphs on graphs! Design is all about conveying information in a visual way, and sometimes that information is data. I’ve been working a lot with various graph types for a dashboard system that will be used by bowling alley management teams. Working with a bright color palette on a dark background helps to create visual interest for this graph style. What do you think? Did I get a strike or a gutter ball with this design? 😏
