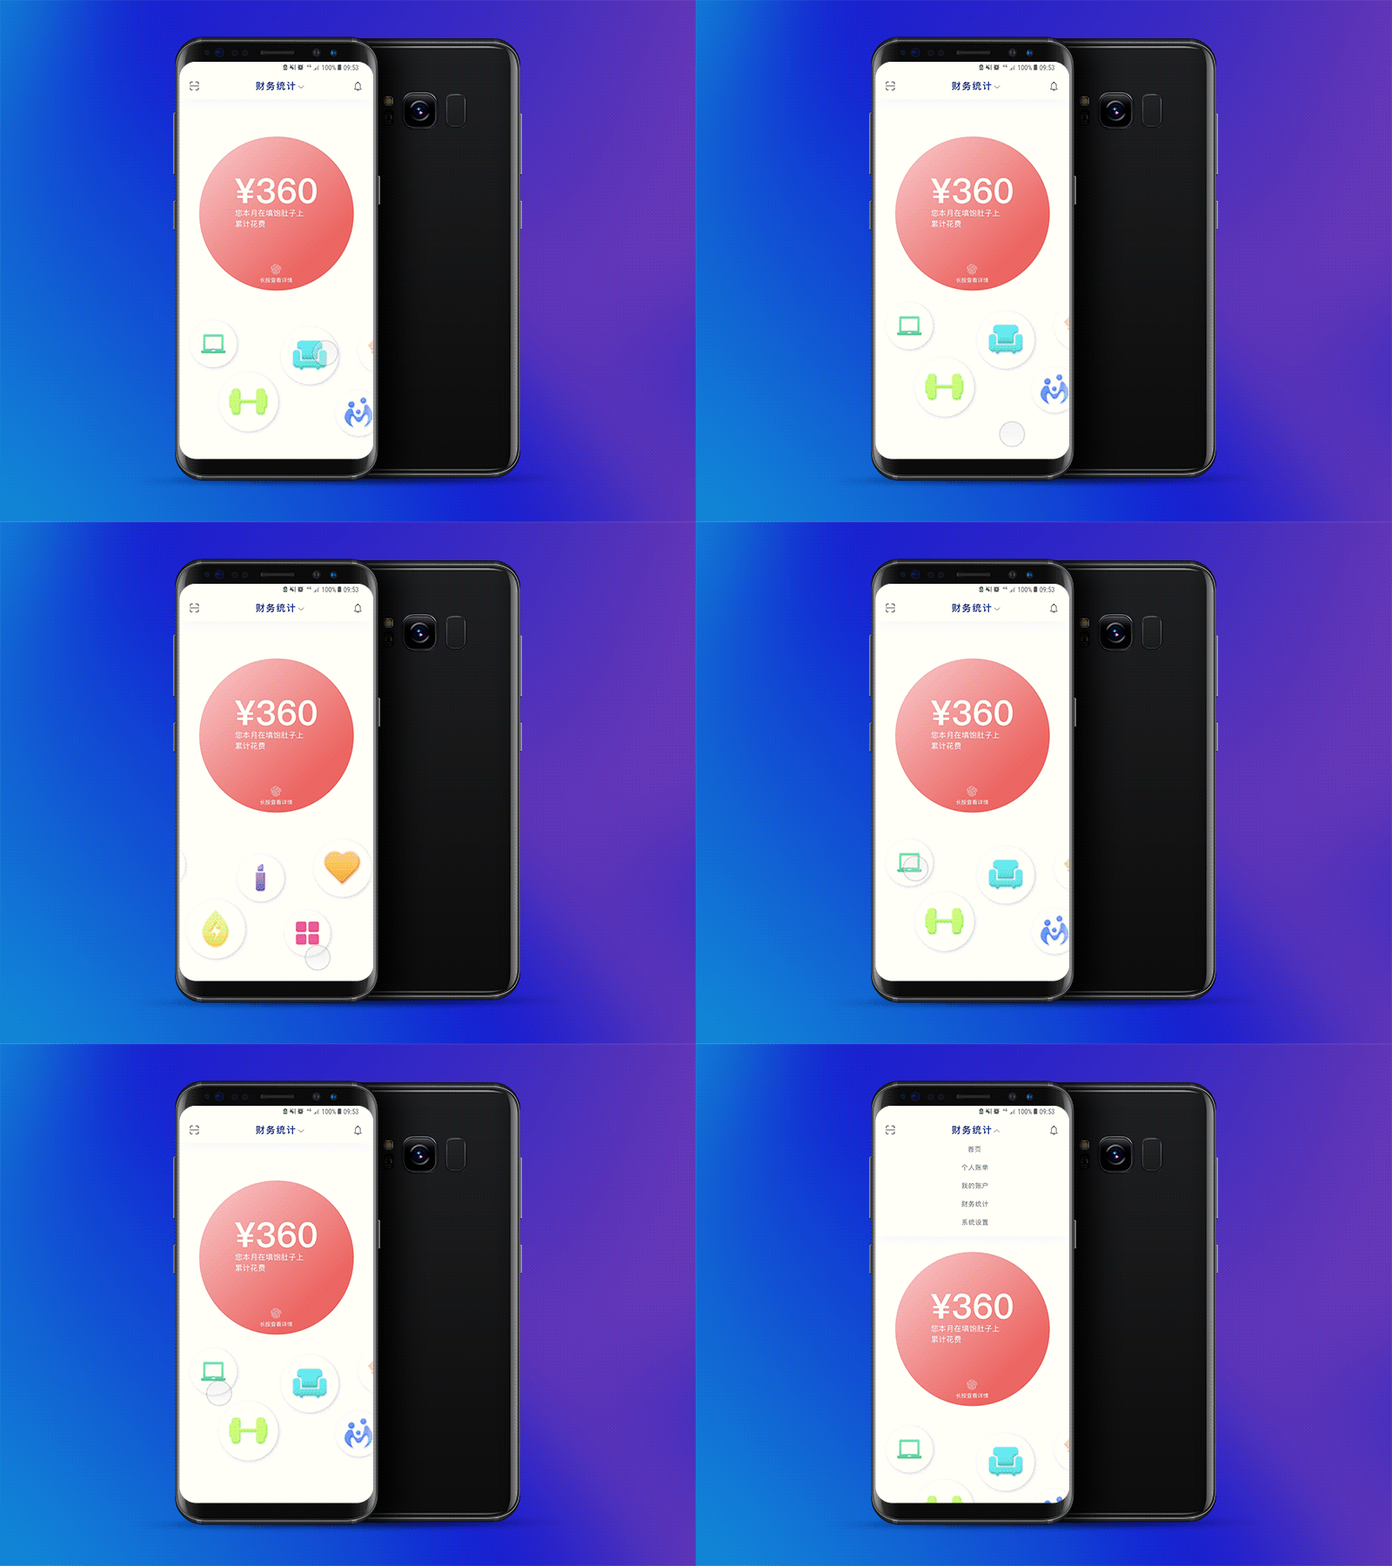
statistics of consumption expenditures UI
This is a personal accounting application. I don't want to use traditional pie charts or bar charts to display statistical results.Because I want to give these data a little fun. So I use each ball to represent each category. You can click on different balls to switch the details, and press long enough to get to the next layer to see the detailed billing record.This is just one of my concepts, and I'll continue to improve the other interfaces as soon as I get the chance
More by Daniel Chen View profile
Like
