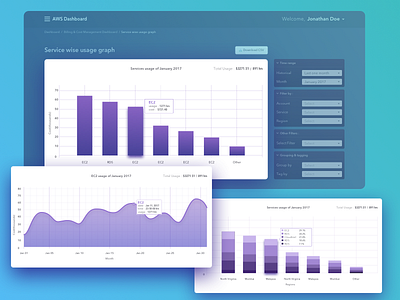
Quick view of the cloud based services' dashboard
A section I designed for showing the data of the cloud services usage for one of the project.
This is just a preview but apart from the bar graphs, line chart and split bar graph, I have used histograms, comparison charts and much more to show the data in an easier and more comfortable way.
Hit "L" if you like it :)
More by Sanchit Sharma View profile
Like

