Lecture Analytics Dashboard
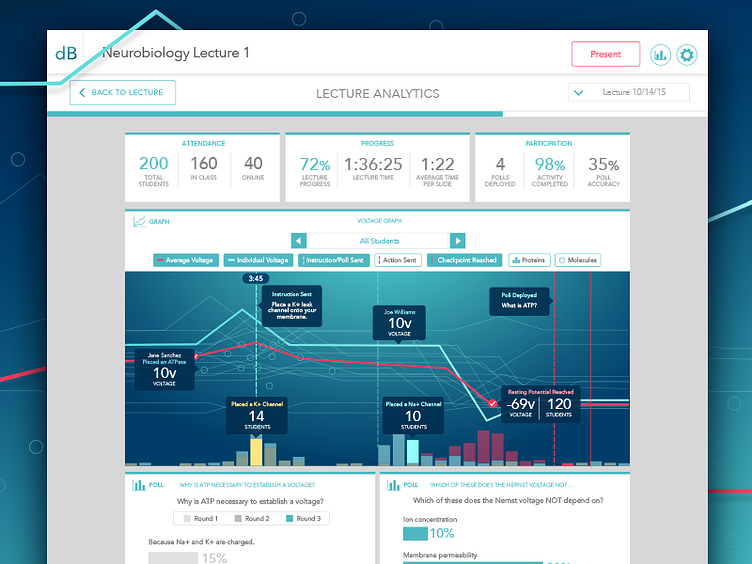
A dashboard I made for a really cool unreleased project, to show data points for things that students can do during the interactive lecture. This is showing all possible hover states and a lot of the layers that can be turned off/on using the buttons above the graph. It was really interesting exploring how to convey the many different types of data all in one graph!
