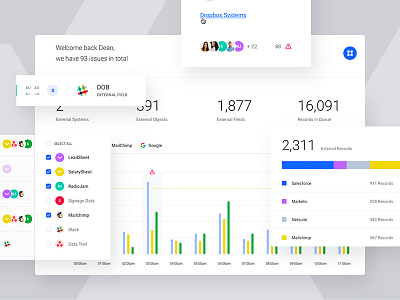
V - Dashboard
Hello everyone,
We have been working on a new data management dashboard called "V" (can't disclose real name for now). V is a new product on the market that will offer companies a great overview of data movement across multiple systems. Basically, it offers users to centralize all data management and have a transparent in depth view of all their processes, systems and technology.
I know it's hard to explain without going into a deep rant about large data management, but to shorten it: "V" is a big data management application that improves information flows across organizations.
We were approached to handle the product by creating wireframes, art direction, color scheme, branding, user experience, user interface design and eventually front end development.
Anyhow in this shot, we are showcasing the dashboard screen that allows users a quick overview of their data flow, records being processed, potential errors and roadblocks, data schedules, activity and workspace management.
In the attachment, you will find the final dashboard design as well as 2 other color and chart explorations.
Wireframes, UI and UX by: @Filip Justić
Interesting in building a similar product? Send an email at:
info@bb.agency


