Graph Illustrations/Icons
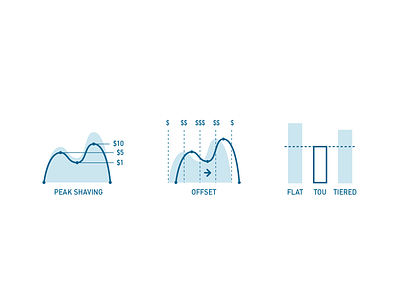
Some graphing "icons" to explain a few of the different techniques and concepts associated with saving energy (and money $$$).
From lowering total usage (Peak Shave), shifting to cheaper usage times (Peak Shift), and just comparing tariff options.
More by David Thorn View profile
Like
