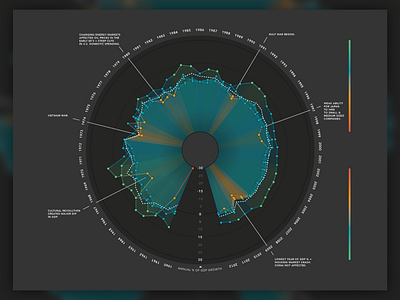
Working with an excel spreadsheet containing GDP data to discover the stories that raw information can tell.