Infographic - Podcast
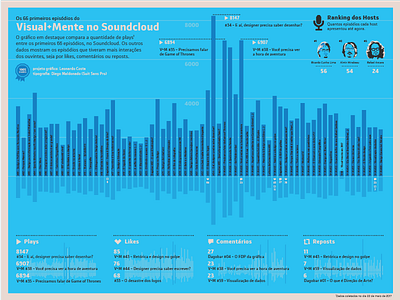
Infographic comparing interaction data (plays, likes, comments and reposts) between the first 66 episodes from the design podcast Visual+Mente.
One particular aspect of the infographic is that it is made only with straight lines.
The infographic in detail: https://www.behance.net/gallery/54013853/infografico-VisualMente-no-Soundcloud
Infográfico que compara os dados de interações (plays, likes, comentários e reposts) entre os primeiros 66 episódios do podcast de design Visual+Mente.
Feito apenas com linhas retas.
More by Leonardo da Costa View profile
Like
