Let's make a bunch of maps for each state
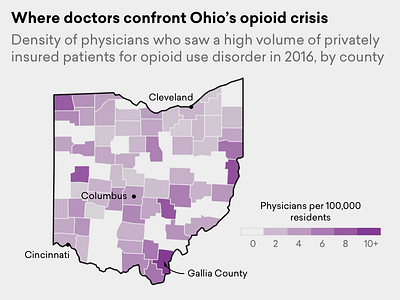
One of the advantages of using R and ggplot to generate charts is highly flexible mapping features. A quick script can crank out individualized maps for each state--perfect for social campaigns. See more here.
