Interactive Graphs
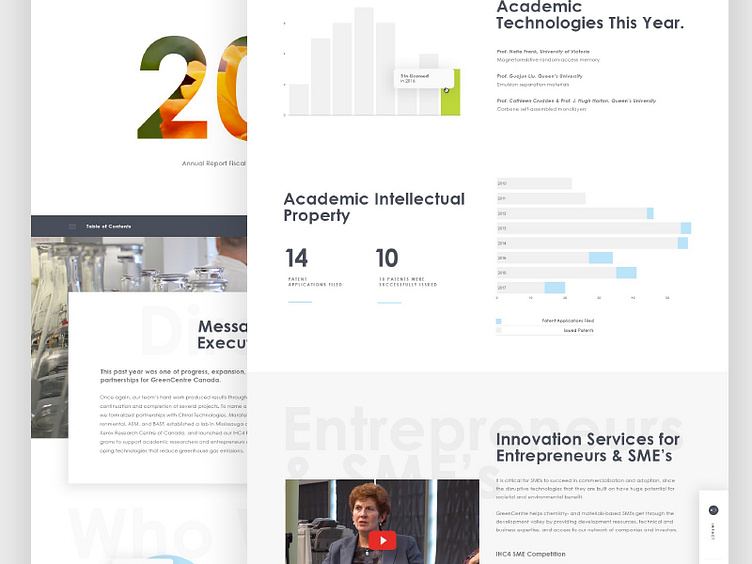
Interactive charts, graphs, and statistical information designed into an annual report (website and booklet) for GreenCentre Canada. Both designs reflect the impact and growth of green chemistry entrepreneurs, businesses, and academics.
The design has dimensional elements that give areas of movement extra depth.
