# of Visits vs. Volume vs. Visit Type Graph
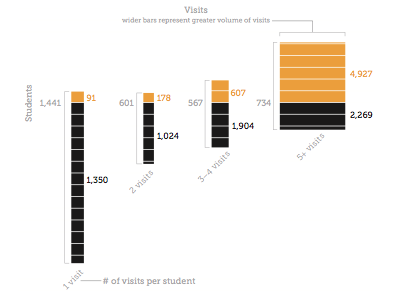
A graph showing how the type of visits to School-Based Health Clinics (Behavioral in orange, Physical in black) corresponds to the number of visits per patient. Wider bars represent a greater number of visits. This graph shows three different data sets in one space.