Dashboard Screen - Analytics App
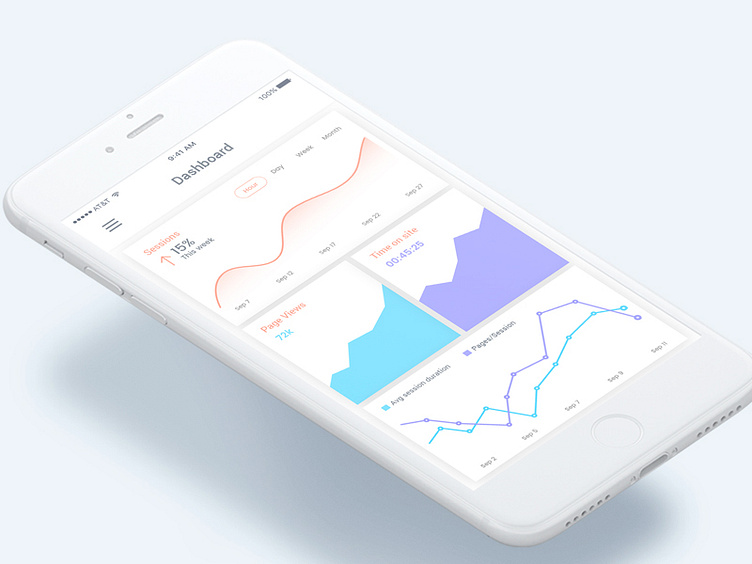
Hello Dribbblers Its the dashboard screen from website traffic analysis Mobile App. First there is a season line chart for showing total season according day, month year. Then page view and time on site. Avg season duration and pages per season line chart in a single graph. Hope you guys will like it. Your feedback is always appreciated! Press "L" to show some love!
