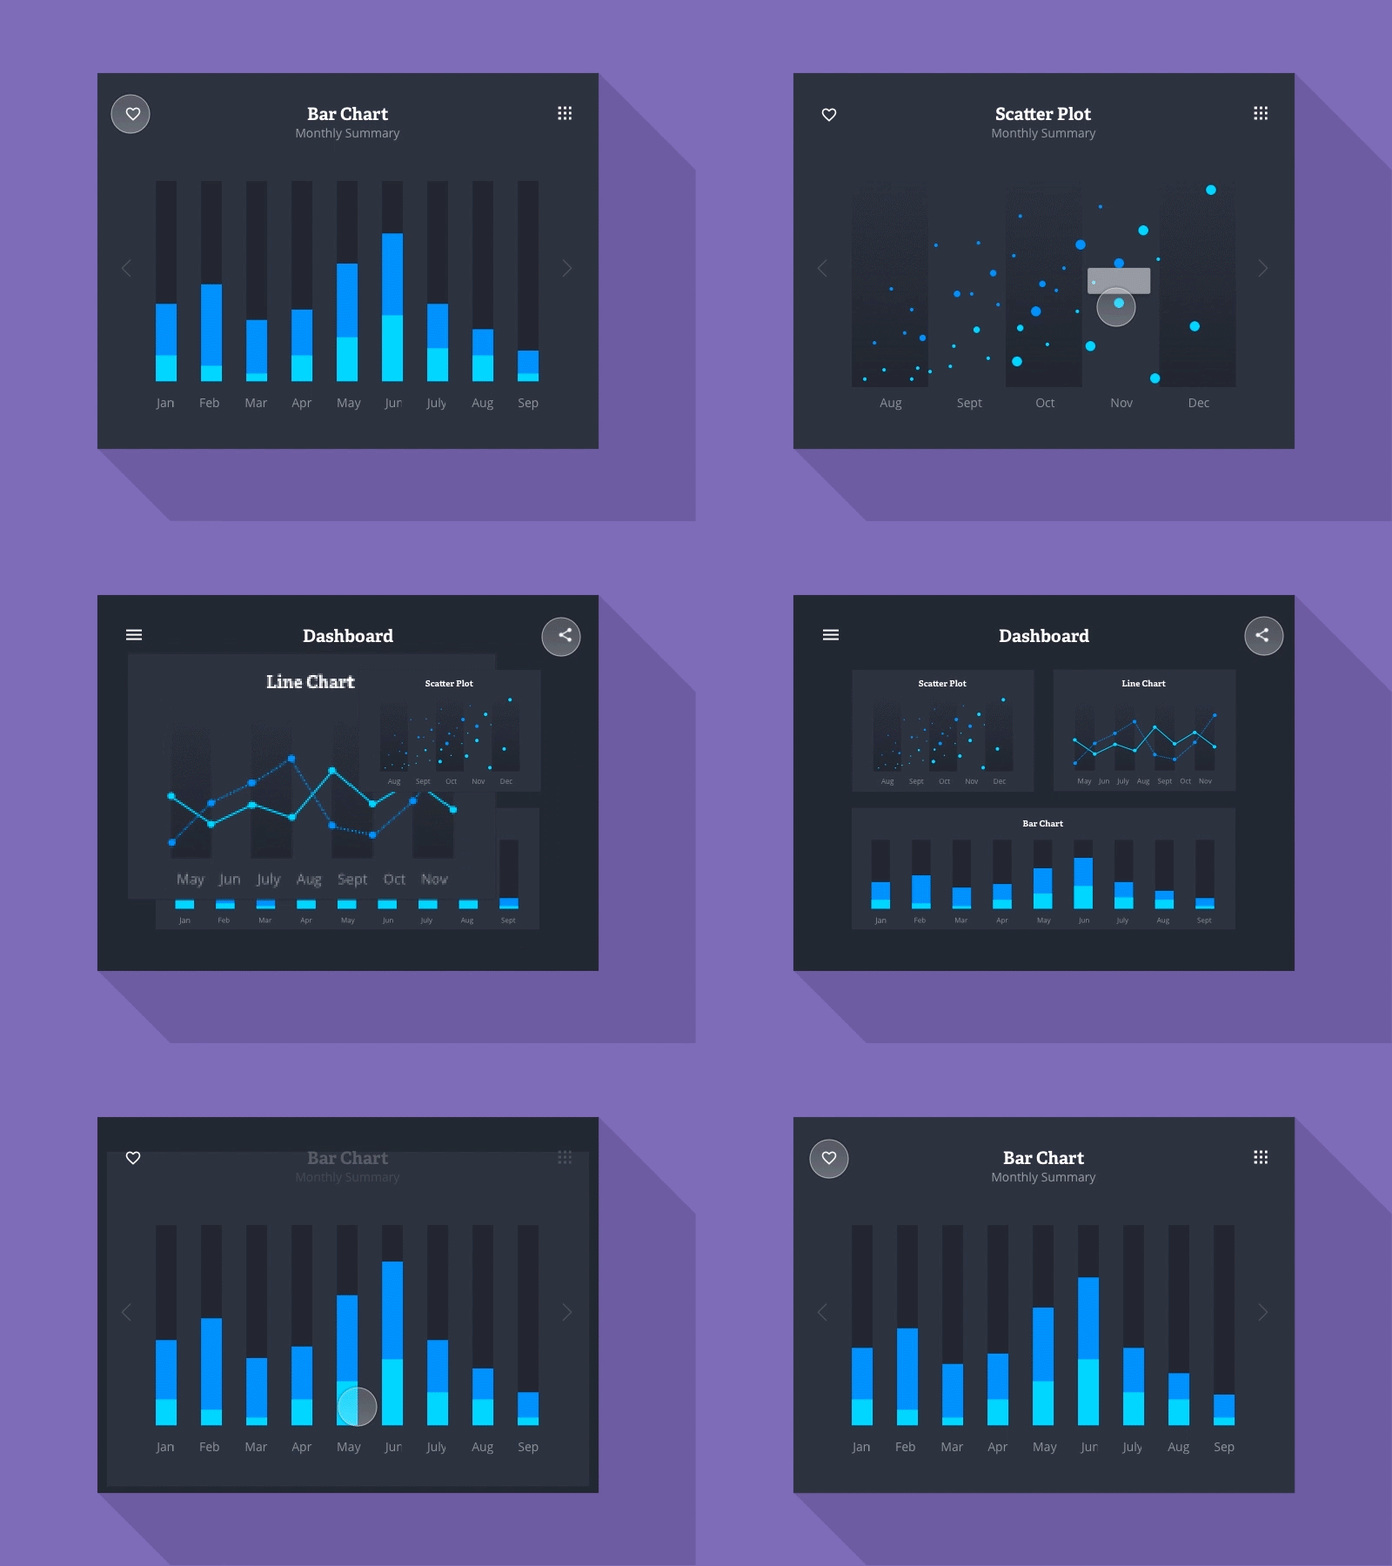
Analytics Chart
#018 #dailyui Thought it would be fun to create an interactive way to view data. The dashboard is customizable by clicking, dragging and placing the charts in preferred locations. Options such as create new, duplicate, delete, share and favorite are also available.
Press L if you like it :)
More by Chad Kendall View profile
Like
