018 Analytics chart
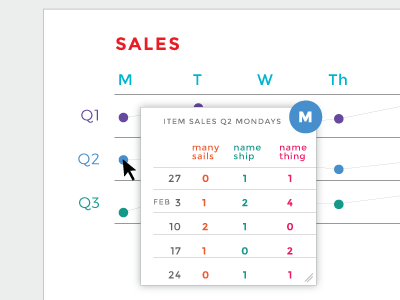
Analytics chart. The idea for this chart is to track sales by day of the week, to see trends. This chart shows days in each quarter. Monday of the second quarter was selected, so this pop-up shows each item and how many sold on each given Monday.
More by Colleen Leh View profile
Like
