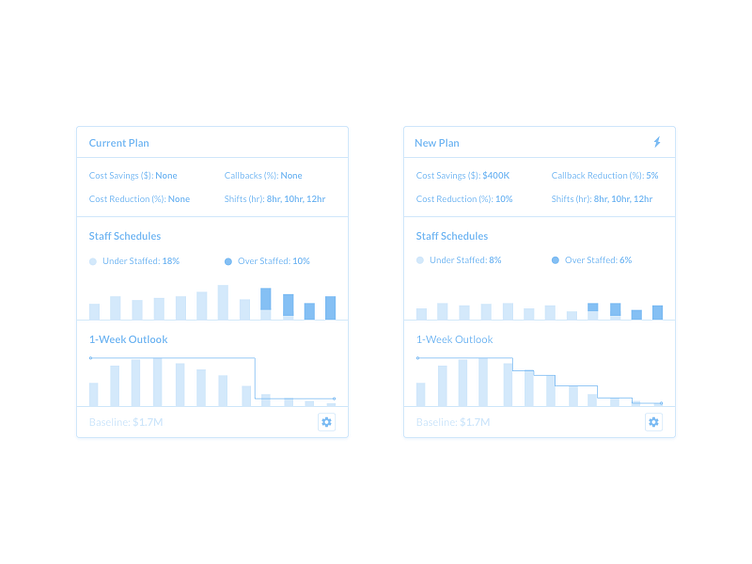
Data Visual Mockup
Working on a concept for visualizing a complex data set in which users need to be able to compare different outputs. Players in our space use tables to showcase data and allow users to make comparisons. The problem is that it is hard to digest and understand what is or isn't important. After boiling down the most important set of data and understanding the core values, you can open up different ways to present the outputs to your users so that it does not overwhelm and is easier to understand.
Open to any feedback you guys have :)
Note: had to edit some info and reupload
More by Steven Gaan View profile
Like
