Data Visualization
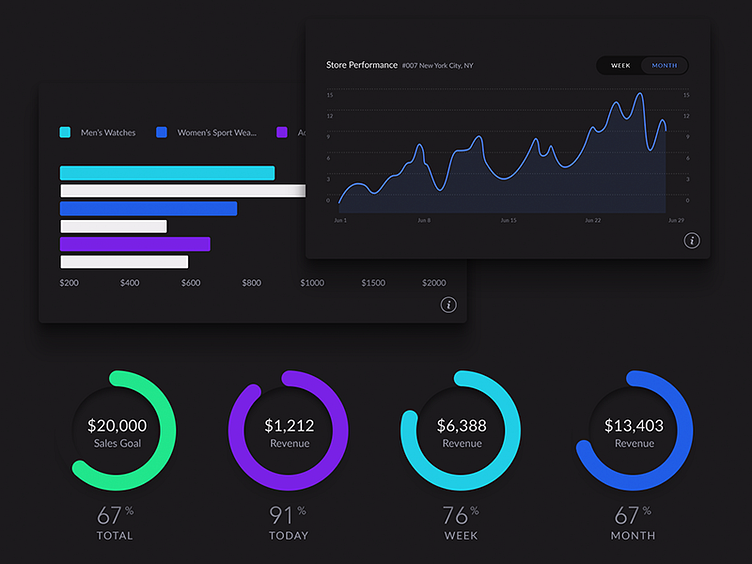
Decided to get back into messing around with theming some of the components from Concierge that we built using react.js. This dark theme which I decided to call Carbon is my favorite so far. The contrast between the chart elements and the surrounding areas on a darker background make a huge difference. My eye settles right on the info I need to know, as opposed to the little grey background its currently on.