Pollen
Picked up the ball on my pollen visualizer side project. I've gotten a hold of a rss-feed (from DMI in Denmark) that provides the daily pollen count for east and west Denmark.
Those numbers are now in use in the prototype but for the sake of the non-pollen season, I've hardcoded a couple of values to imitate the what those numbers look like.
Main features:
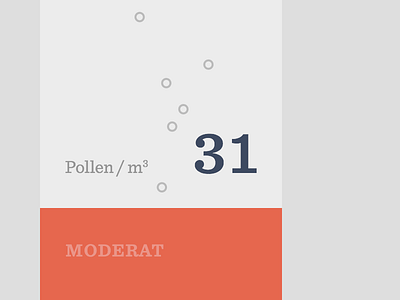
Uses real pollen data from the national weather service.
The number of particles in the air reflects the pollen count.
http://pollen.esbenhindhede.dk/02/
Future additions:
A more interesting way of visualising this. Maybe with a face that shows how bad the allergy affects you?
Would love to hear your input.